To measure the muon lifetime, we set up
another experiment using scintillators. This time, we used three
scintillators, a simple metal rectangular structure and some blocks
of lead. We put the first scintillator on the top of the structure,
the second inside it, on the lead blocks, and the third under it.
The idea was that the muons that go
through the lead lose much of their energy (the lead is very dense)
and stop in the third scintillator. Here they decay and we can
measure the decay time (but most of the muons we detected seem to
decay in the second scintillator).
Normally, muons have a very short
lifetime (2.2 microseconds), after that they decay into an electron
and two neutrinos. But, since they travel very fast and because of
the time dilation, „their“ time goes much slower, and they can
reach the ground before decaying. So, I already said that a muon
entering the scintillator produces a photon. Well, in the decay
process, energy is produced and so another atom is excited and emits
another photon, still detected by the photomultiplier.
By calculating the time between these
two signals, one can tell after how much time the muon has decayed.
Since QuarkNet provides all the data it receives, in form of text
lines, and since we care only of „double events“, Robert wrote a
Python program that examines this data and takes only the „double
events“, that is, an entering muon and a signal in one of the lower
scintillators within 20 microseconds. The upper scintillator works as
a veto for the decay signal (this means, events that
are not detected in the first
scintillator and signals too far in time are considered as noise and
ignorated. Muons that arrive while another muon is decaying are also
ignorated).
In order to have a high amount of data
(double events are rare), we let the scintillators run for 4 days,
trying several positions and combinations of the material: after two
days, we set the distance between the three scintillators much
shorter and then we removed the lead. The quantity of data went much
bigger and we were able to achieve a much more accurate lifetime
measurement. This is because, with the detectors closer together,
also muons that come from the side are detected, we have a wider
angle.
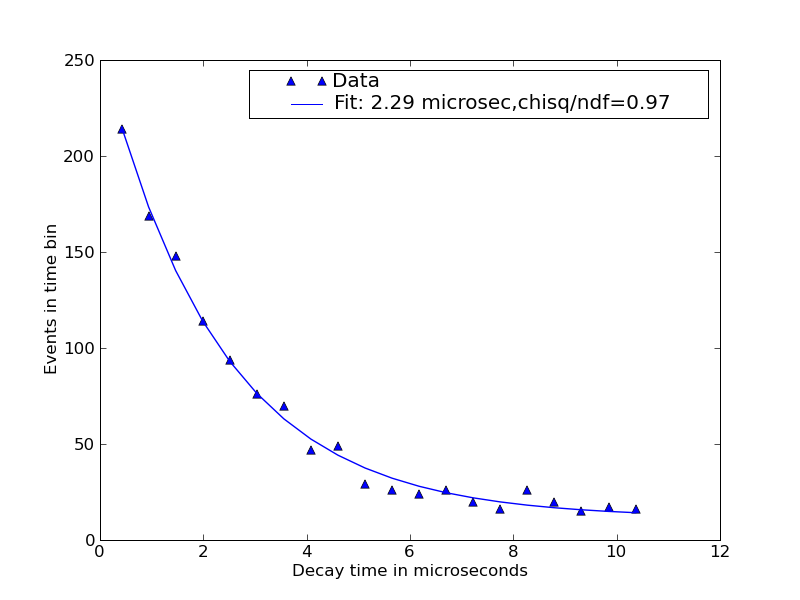
Using other programs, the theoretical
lifetime curve was fit to the measurements to extract the lifetime.
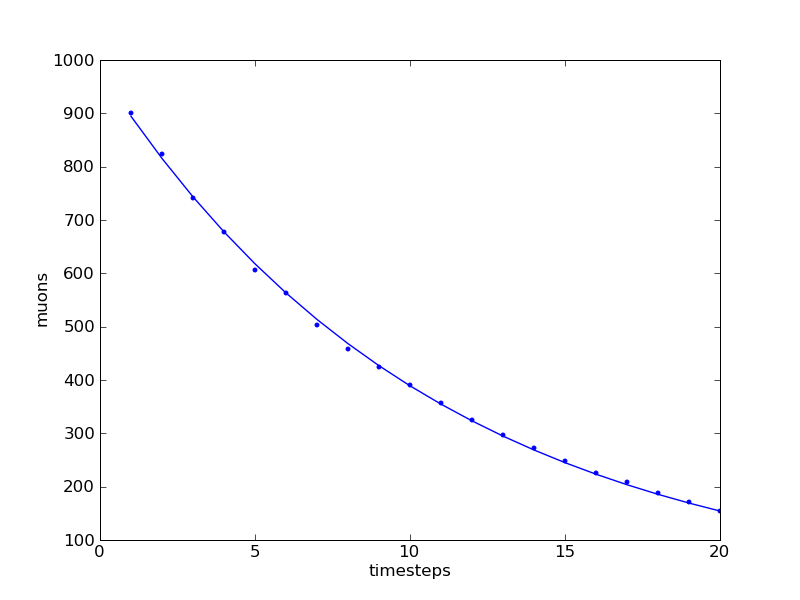
Then, after learning Python, a
relatively simple programming language, I wrote another program to
simulate muon decay, based on
probability. The plot I took from the result was nearly matching the
theoretical curve, because no experiment was done (also after all
these precautions, there is a „noise“ probability).